北極振動 wikipedia
http://ja.wikipedia.org/wiki/%E5%8C%97%E6%A5%B5%E6%8C%AF%E5%8B%95
http://en.wikipedia.org/wiki/Arctic_oscillation
AOのデータは以下から入手できる。
http://www.cpc.ncep.noaa.gov/products/precip/CWlink/daily_ao_index/ao.shtml
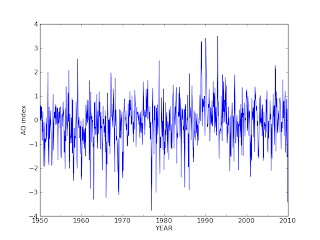
プロットしてみる
以下プログラム(python)。scikits.timeseriesを使っている。
readAO.py
def readAO():
"import monthly AO data"
import numpy as np
import scikits.timeseries as ts
# data is downloaded from http://www.cpc.ncep.noaa.gov/products/precip/CWlink/daily_ao_index/monthly.ao.index.b50.current.ascii
f=open("monthly.ao.index.b50.current.ascii",'r')
data=np.loadtxt(f)
f.close()
AOindex=data[:,2]
year=data[:,0]
month=data[:,1]
# make time series
tbeginmonth=str(int(year[0]))+"-"+str(int(month[0]))
dbeginmonth=ts.Date('M', tbeginmonth)
AOindex_series=ts.time_series(AOindex,start_date=dbeginmonth,freq='M',mask=(AOindex<-99.))
return AOindex_series
##################################
if __name__ == '__main__':
import matplotlib.pyplot as plt
import scikits.timeseries as ts
import scikits.timeseries.lib.plotlib as tpl
from datetime import datetime
AOindex_series=readAO()
fig = tpl.tsfigure()
fsp = fig.add_tsplot(111)
fsp.tsplot(AOindex_series, '-')
istart=fsp.get_xlim()[0]
iend=ts.Date('M','2010-1').value
fsp.set_xlim(istart,iend)
plt.xlabel("YEAR")
plt.ylabel("AO index")
plt.savefig("AOindex.png")
plt.show()

0 件のコメント:
コメントを投稿